

Many people have heard of a carbon footprint. Maybe they have taken one of the many online tools to calculate their own or have seen it calculated for a product they were buying. Maybe some are sceptical because they have read that oil companies were behind its development to place the responsibility for reducing emissions on individuals. But what is a carbon footprint really, how do we go about calculating it, and how can it be useful in helping societies, not just individuals, transition to a 1.5°C world?
The simple starting point for footprints is that all the activities that we do and products that we use in our daily lives each have their impact. A product’s carbon footprint is the total climate impact of the product from production to disposal, typically calculated using a method called life cycle assessment. A person’s carbon footprint is the combined total impact of these activities and products.
It gets more complicated from there. First, it’s important to note that when using carbon footprints, we are only considering greenhouse gas emissions for the climate impact, as opposed to other methods such as ecological footprints that can also measure impacts such as water, land, or material use.
Another important thing to note is that the carbon footprints of people’s lifestyle choices are often measured differently than greenhouse gas emissions accounts of countries. For example, with international agreements such as the Paris Agreement, emissions levels (and targets) for countries have been calculated by adding all the emissions directly from activities within the country’s borders. This includes all domestic processes like electricity production, cement and product manufacturing, and fuels burned while driving, among other activities.
Of course, some of what is produced in one country is traded and consumed in another country. Some countries produce a lot fewer material products than they consume. Countries, like Sweden, for instance. For these countries, the approach of only counting emissions taking place in the country (production-based emissions) will suggest a lower carbon footprint than measuring the emissions linked to what is consumed by the country (consumption-based emissions).

A production-based approach only gives part of the picture of emissions in a country. Recognising this, Sweden is one of the first countries that intend to set targets for consumption-based emissions.
When we are looking at our personal or household footprints, using a production-based carbon footprint doesn’t make much sense, of course. What we mainly do at home is consume – food, products, and energy (though good on you if you are producing your renewable energy!)
So, many carbon footprints take a consumption-based approach. To do this, they use data about our personal or household consumption. These could be in the form of surveys – for example, the WWF has a popular calculator. Some calculators are general and some are more specific to consider the local context in the questions asked and the data used for calculating. For example, the questions for the WWF calculator in Sweden will ask about district heating and summer houses and consider typical building materials and energy mixes in Sweden when calculating the footprint.
Using specific data versus general data can change the outcome of the footprint. Using different years can too, as conditions and emissions change over time. This can be seen with the case of Sweden again, where footprints can vary year to year as events like recessions and pandemics affect consumption patterns and levels.

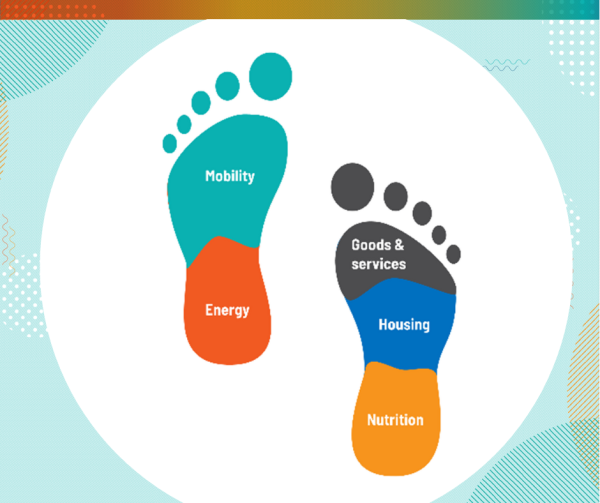
The areas of consumption that are considered also influence the total footprint. Calculators can differ greatly in the consumption dimensions they cover (for example, some might only include one question about diets, if at all). However, many calculators consider the major areas that contribute to consumption emissions: food, housing, transport and leisure activities. There are also investments, for example, the purchase of buildings, machines, computers, valuables and inventory that have associated emissions from a consumption-based approach. Some calculators might also include emissions from government spending on infrastructure or public institutions like schools, hospitals, or defence (“public” emissions in the figure below). Individuals benefit from these services so they can be included in an individual carbon footprint despite the relative lack of control over these emissions

You can see from the Swedish example that public consumption accounts for approximately 1 tonne of CO2e per person and investments account for 2-3 tonnes of CO2e per person. But you can also see that both the totals and the relative emissions from different consumption categories can change with time – again, so the year of the data can change the results.
For the Citizen Labs in the EU 1.5° Lifestyles project, we used 2015 data and only included household consumption. The calculation for the average carbon footprint in Sweden was 6.2 tonnes of CO2e– again not including investments and public spending. Next month’s blog will go into more detail!
Carbon footprints are models, essentially our best estimates. They will vary depending on the approach and data used, but they can be very useful for highlighting high-emissions hotspots in our lifestyles that need attention. However, as the EU 1.5° Lifestyles project emphasises, addressing these hotspots is not just about individual change, but requires changing the structures around us. This transformative approach can make 1.5ׄ° lifestyles not just possible, but better than our lifestyles today.
Jessika Luth Richter, Stephanie Cap, Matthias Lehner